Litecoin (LTC) established its record high at over $400 in May 2021. As of early 2026, the so-called silver crypto was trading for around $83, almost 80% below the said milestone.
Can this be the year where LTC retest its glorious peak? Let’s examine.
Litecoin’s Evergreen Trendline Hints at 100% Gains For Now
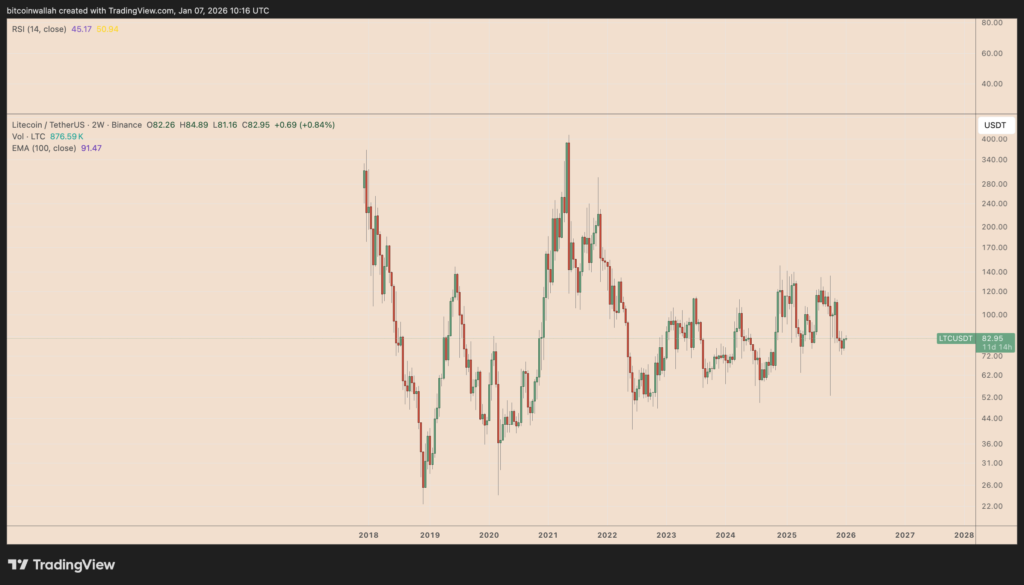
Litecoin’s long-term chart reveals a recurring pattern that has quietly defined its major cycle lows: repeated bounces from a rising, multi-year ascending trendline. Since 2018, LTC has tested this support several times, and each successful defense has preceded a meaningful upside phase.
A notable example occurred in 2019, when Litecoin rebounded from this trendline and rallied by more than 550% over the following months. A similar setup emerged during the 2020–2021 cycle. After briefly dipping into the same support zone, LTC went on to post a nearly 1,600% advance, ultimately topping above $400 during the spring 2021 bull market.

More recently, Litecoin defended this trendline again in 2023 and 2024, producing smaller—but still respectable—moves in the 180%–200% range. While those rallies fell short of igniting a full cycle breakout, they reinforced the trendline’s role as a structural accumulation zone rather than a breakdown point.
The current setup looks familiar. LTC is once again bouncing from this long-term support.
However, the follow-through so far remains measured from a technical perspective, which argues for realistic interim expectations rather than immediate cycle-high ambitions. If history rhymes, Litecoin could stage a continuation move toward the $100–$162 zone—an area aligned with prior resistance levels and key Fibonacci retracement bands.
A return to record highs above $400 would likely require a broader, sustained risk-on cycle rather than a standalone technical breakout. For now, the chart suggests recovery potential is building, but the distance to all-time highs remains substantial.
Macro Liquidity, Rate Cuts, and Whether On-Chain Data Backs a 2026 Rally
Beyond the chart, macro conditions may quietly tilt in Litecoin’s favor in 2026.
Expectations of easing financial conditions, driven by potential rate cuts and rising global liquidity, have historically benefited risk assets, particularly large-cap cryptocurrencies with established market depth. Litecoin, often viewed as a high-beta proxy within the crypto complex, has tended to respond positively during such liquidity expansions.

On-chain data offers a more grounded signal. The spot Accumulation/Distribution Line (ADL) for Litecoin shows a steady upward drift since mid-2022, even as price action has remained range-bound. This divergence suggests that spot market participants have been gradually accumulating LTC rather than distributing into rallies.

Importantly, the ADL did not collapse during recent price pullbacks, implying selling pressure has been relatively contained. That behavior aligns with a market transitioning from aggressive distribution toward longer-term positioning. The metric supports the case that Litecoin’s current base is being built on accumulation rather than speculative excess.
Litecoin may not rise to a record high in 2026, but it appears to be gearing up for such scenarios in the coming years.